Telling your story, with data
How do we help you compete for, and win, the time and attention of your audience across all platforms, all devices?
Telling your story, with data
In today’s hyper-connected world, every brand must be a content publisher, using data to tell their stories. The challenge to cut through the noise and grab consumers’ attention and help them make a decision — easily and painlessly — has never been greater.
As humans, we are wired to use as little energy as possible to make decisions (we’re only human!). The easier it is to consume and understand data, the easier it is for us to act on it. And how do we understand data? The same way we’ve always come to understand anything — storytelling.

We’ve heard the above get attributed to several historic figures, but whoever said it, it holds true. It takes more time, thought and effort to craft a succinct version of a complex story, and still convey its key points. The best data storytelling does exactly this; takes complexity and makes it simple and comprehensible. And that’s where we come in.
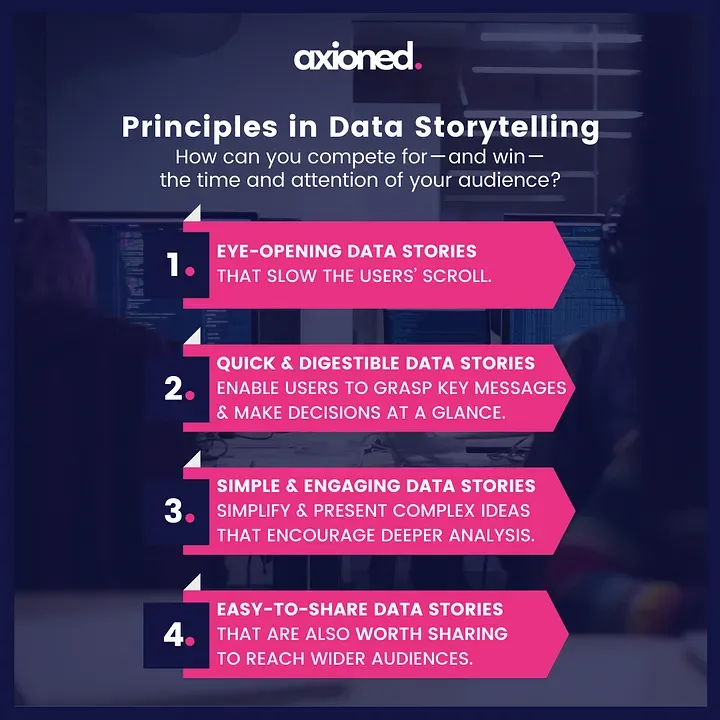
How can you compete for — and win — the time and attention of your audience?
Based on our experience to date, we’ve established the following “Top 4 Principles” with respect to creating compelling and actionable stories with data.
Case Study: Heterodox Academy
Using data to tell stories of your achievements and future goals.
As a non-profit advocacy group, Heterodox Academy actively researches and reports on just how much educational environments welcome and encourage open inquiry, viewpoint diversity and constructive disagreement.
Axioned helped this client visualize and present the results of their research in a way that helped users to comprehend and interact with the data, through a desktop, tablet- and mobile-friendly user interface using web-embedded Microsoft Power BI data visuals.
Case Study: Process Management Consultancy
Supporting real-time, data-driven decision-making.
An industry-transforming business and process management consultancy needed to digitize the large technology asset workflows of a global aerospace and defense client.
By incorporating a range of relevant data sources, we helped with the implementation of their client’s ServiceNow platform. And by doing so, we more easily identified project-related opportunities and risks, while providing an up-to-date view on the project’s progress and success.
We worked closely with them to:
- Build a system to ingest their specific data sets and other relevant data store
- Build models to aggregate and consolidate data and information
- Easily identify emerging patterns and trends not supported by standard reports
- Build for scale: a continually improving program to more rapidly identify critical insights
- Enable data selection and categorization, to reveal the “ultimate truth” amongst overlapping data sources
Case Study: Global PR Agency
Condensing complex data into a compelling digital experience.
A Global PR Agency was working with their client to create a compelling visual and data-driven story to drive a deeper understanding of a certain medical ailment. The Agency came to Axioned to help bring this story to life in the digital arena, using JavaScript-driven animations consistently across desktop, tablet and mobile. The end result is a clean and compelling telling of a very complex story.

Case Study: Global Publisher
Using data to communicate & quantify future visions.
When working with future-facing data, especially where the outcomes and impacts might be hard to quantify in the context of current situations, data storytelling is key.
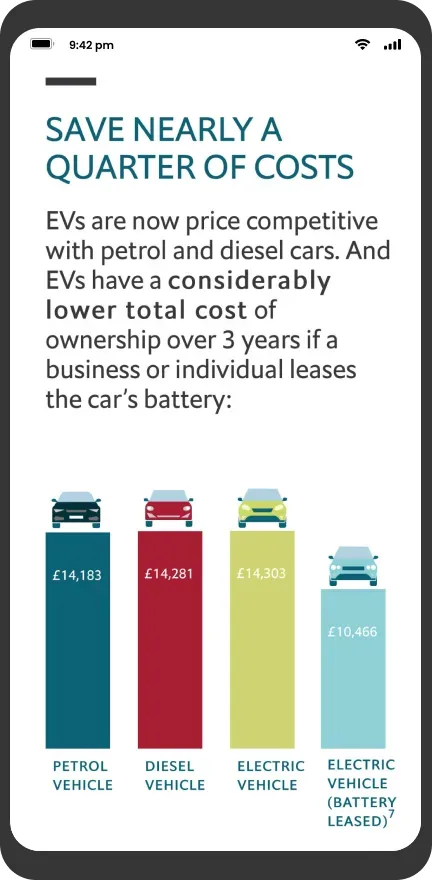
This Global Publisher worked with Axioned to help their client and partner develop and publish various compelling data stories around the future of energy, electricity and mobility. The Axioned team made the user experiences interactive and mobile (through HTML/CSS and Javascript technologies).
Axioned works with clients to both design and build “data stories”. The technologies we typically use to support such experiences include Javascript libraries/frameworks such as D3.js, as well as solutions like Microsoft BI, Tableau.
For further information contact us or schedule a time to meet.